
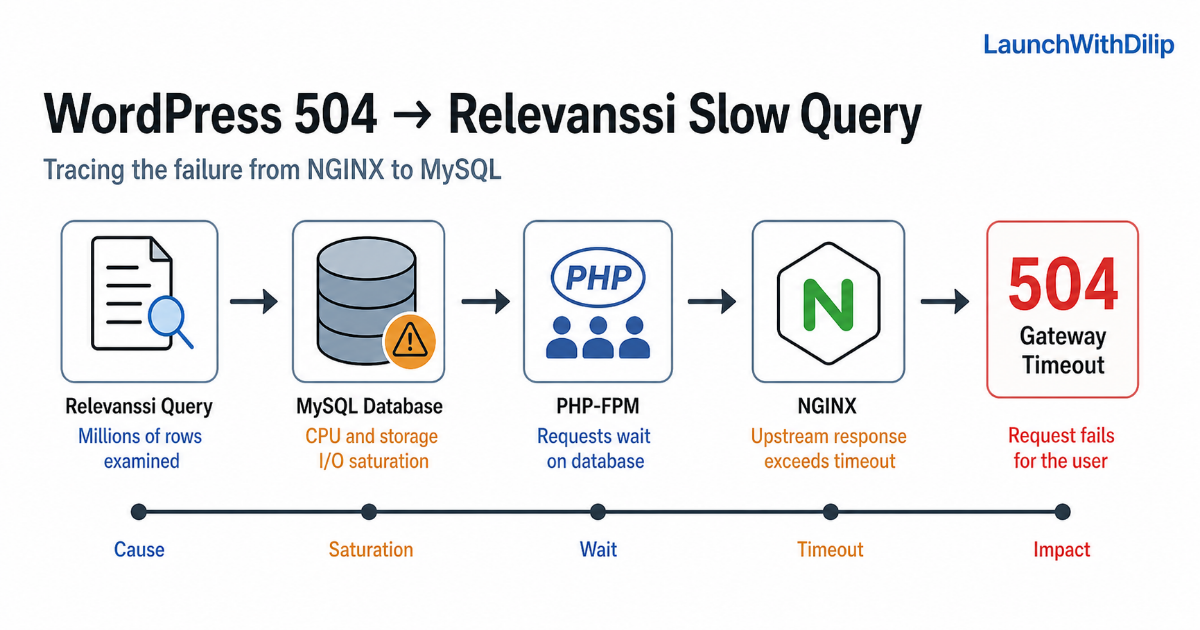
The incident started when users reported that the WordPress application was unavailable or timing out. I opened the site and reproduced a 504 Gateway Timeout in the browser. That gave me a precise symptom to follow instead of treating the event as a generic application outage.
I checked the NGINX logs next and found matching upstream timeout or failure evidence. The request was reaching NGINX, but the upstream application path was not returning in time. I followed that path through the EKS-hosted WordPress workload, PHP-FPM and finally the managed MySQL database. Database CPU was at or near 100%, storage I/O pressure was significant, and the downloaded slow-query logs exposed the Relevanssi query pattern behind a large share of the work.
1. Reproducing the 504 in the browser
I reproduced a 504 Gateway Timeout myself. That mattered because a 504 is more specific than “the site is down”: a gateway or proxy waited for an upstream response and reached its timeout. It did not tell me which dependency was slow, but it gave me the correct request path to investigate.
2. Confirming the failure in NGINX logs
The NGINX logs contained matching upstream timeout or failure evidence. That established that NGINX accepted the request and then waited too long for the application path behind it. It moved the investigation beyond the browser and toward the upstream workload.
3. Inspecting the EKS-hosted application
The WordPress application was hosted on Amazon EKS. I checked the relevant workloads, pods, restarts, readiness, replicas, Services, endpoints and application health. Those checks were necessary because a broken endpoint, unhealthy pod or deployment problem can also leave NGINX waiting.
The workload review did not make Kubernetes the root cause. A pod can remain Running and Ready while PHP is blocked on a slow dependency, so the investigation continued into the runtime.
4. Inspecting PHP-FPM
I then reviewed PHP-FPM behavior and logs. The evidence indicated that PHP requests were not receiving timely responses from the database. PHP-FPM was part of the timeout chain, but it behaved as a victim of database latency rather than the original source of the load.
5. Checking database metrics
Once the request path pointed to MySQL, I checked the managed database metrics. CPU was at or near 100%, and storage I/O pressure was significant. The recovered Storage IO Percent screenshots independently show the metric rising from a lower, variable baseline to a sustained value near 100% in the incident-day window.
The graphs proved saturation, but a CPU or I/O graph cannot identify the SQL responsible. I needed query-level attribution before handing the issue to developers, so I downloaded the MySQL slow-query logs.
6. Downloading and reading the MySQL slow-query logs
I inspected query duration, lock time, rows returned, rows examined and the SQL fingerprint. Those fields distinguish an expensive execution from lock waiting and show how much work MySQL performed to produce the result.
One representative Relevanssi reporting entry had the following values. The identifying database and table prefix are deliberately omitted.
Query_time: 7661.704000
Lock_time: 0.000000
Rows_sent: 100
Rows_examined: 18076470
The query ran for more than two hours, examined 18,076,470 rows and returned only 100 rows. Lock time was zero, which is important: this entry was not spending those hours waiting for a table lock. The recorded work was dominated by reading, grouping and sorting.
Other copies of the same fingerprint in the recovered April log completed between roughly 7,753 and 8,028 seconds and examined about 18.076 million rows. I did not add those durations together as outage time. Slow queries can overlap, and the downloaded files themselves contain overlapping samples.
7. Identifying the Relevanssi reporting query
SELECT COUNT(DISTINCT(id)) AS cnt, query, hits
FROM wp_relevanssi_log
WHERE time >= '[multi-year start]'
  AND time <= '[incident-day end]'
  AND hits = 0
GROUP BY query
ORDER BY cnt DESC
LIMIT 100;
The public excerpt preserves the SQL behavior while replacing the identifying table prefix and dates. The report covered more than three years of Relevanssi search-log data, selected searches with no results, grouped them by query and sorted the aggregate to return the top 100. Limiting the output did not stop MySQL from examining about 18 million rows to produce it.
Rows examined is often more useful than rows returned during this kind of investigation. Returning 100 records may look harmless from the application, while the storage engine performs orders of magnitude more work underneath. The broad range strongly suggests accumulated logging data contributed to read amplification. It does not by itself prove the table had exactly 18 million rows or that no retention policy existed; those claims would require table metadata and configuration history.
8. Search and autocomplete were expensive too
The slow log contains another Relevanssi fingerprint used by search or autocomplete. It combines forward-prefix matching, reverse-prefix matching, a published-post subquery, DISTINCT, a computed relevance score, sorting and an internal limit of 500.
SELECT DISTINCT(relevanssi.doc), relevanssi.*, [score] AS tf
FROM wp_relevanssi AS relevanssi
WHERE (
  relevanssi.term LIKE '[prefix]%'
  OR relevanssi.term_reverse LIKE CONCAT(REVERSE('[prefix]'), '%')
)
AND relevanssi.doc IN ([published-post subquery])
ORDER BY tf DESC
LIMIT 500;
The application repository confirms that its custom search code deliberately used both forward and reverse prefix matching. It also ran separate categorized and uncategorized Relevanssi searches for one AJAX interaction. In the most complete April sample, the logged searches took between 10.054 and 78.500 seconds and examined between 4,331 and 26,077 rows each.
A separate May slow-log sample showed the behavior recurring. Its local analysis counted 104 Relevanssi search entries, averaging 16.88 seconds and peaking at 66.142 seconds. I kept that sample outside the April timeline: it supports recurrence, not one continuous outage.
9. Why the query became expensive
The reporting query combined a multi-year range, `COUNT(DISTINCT)`, grouping and sorting over accumulated log data. The search fingerprint combined an `OR` across forward and reverse prefix columns, DISTINCT, a subquery, computed ranking, sorting and a high internal limit. These are verified properties of the captured SQL, not a claim that any one property alone caused the incident.
I did not recover `EXPLAIN`, `SHOW INDEX`, the exact table size or the Relevanssi retention configuration. That means I cannot honestly claim a missing index or absent cleanup policy as the confirmed defect. The measured duration and rows examined are enough to show the production cost without guessing at the optimizer plan.
10. How database saturation became a 504
Cause-to-impact chain
Relevanssi query examines millions of rows → MySQL CPU and storage I/O saturate → database responses slow → PHP-FPM requests wait → NGINX reaches its upstream timeout → browser receives 504 Gateway Timeout.
Read from the user symptom inward, this is the path I followed. Read from the cause outward, the strongly supported chain is: expensive Relevanssi reads contributed to database CPU and I/O saturation; delayed database responses held PHP requests; NGINX waited on that upstream path; the browser received a 504.
The April log also contains expensive non-Relevanssi WordPress queries. That prevents me from claiming Relevanssi was the only source of load. The evidence supports Relevanssi-related read amplification as a major contributor to database pressure, with other costly SQL requiring the same review.
11. Immediate containment
The available record does not preserve the immediate containment action. I cannot say that I killed a query, disabled statistics, cleaned the log table, changed plugin configuration or reduced traffic. Those would all be plausible responses, but none is documented well enough to present as something that happened.
12. What I shared with developers
I handed the development team the NGINX timeout evidence, PHP-FPM behavior, database CPU and storage-I/O findings, slow-query SQL, query duration, lock time, rows examined and the affected Relevanssi tables. “The database is slow” is difficult to act on; a reproducible SQL fingerprint showing 18,076,470 rows examined for 100 returned rows gives developers a concrete application path to inspect.
13. What the developers changed
The evidence was shared with the development team, who implemented an application-side remediation. The exact code-level or query-level change is not included here because it could not be verified from the available incident record.
I searched the available application repository across 1,759 commits, including the incident window and terms related to Relevanssi, logging, retention, indexes and the captured SQL. No post-incident commit demonstrates a reporting-query rewrite, cleanup, logging change or new index. The repository confirms the pre-existing search behavior, but it cannot identify the permanent fix.
14. Recovery validation
After the developers made the required changes, the issue was resolved and the application became available again. The retained record does not contain exact post-fix 504 rate, response-time, CPU, I/O or slow-query values, so I cannot publish a before-and-after percentage.
For a complete recovery record, I would confirm that 504s stopped, representative pages and search requests completed normally, PHP-FPM pressure cleared, database CPU and I/O returned toward baseline, and the expensive fingerprint disappeared or became materially cheaper under normal traffic.
15. What I would monitor now
- Database CPU and Storage IO Percent as separate resource limits.
- Slow-query count, maximum duration and rows examined by fingerprint.
- Relevanssi log-table growth and retention-job success.
- Search and reporting request volume and concurrency.
- PHP-FPM active, idle and queued workers where available.
- NGINX upstream response time and verified 5xx rate.
- Deployment markers on the same incident timeline.
16. Lessons from the incident
- Start with the user-facing failure and reproduce the exact status.
- Confirm the same symptom in NGINX before moving downstream.
- Follow the request path layer by layer; healthy pods do not guarantee healthy dependencies.
- PHP-FPM can be the victim of database latency rather than its cause.
- CPU and I/O graphs identify pressure, while slow-query logs provide attribution.
- Rows examined exposes discarded work behind a small result set.
- Plugin logging and statistics can become production workloads.
- Give developers the SQL fingerprint, measured cost and resource correlation—not only a generic database alarm.
17. What I would check first next time
- Reproduce the 504.
- Check NGINX upstream timeout evidence.
- Inspect EKS workloads, Services and endpoints.
- Check PHP-FPM wait behavior.
- Check database CPU, storage I/O and active sessions.
- Download the slow-query logs before rotation.
- Rank queries by duration and rows examined.
- Check Relevanssi table growth and retention.
- Share the SQL fingerprint and database metrics with developers.
- Validate availability, error rate and resource recovery after the fix.
References and further reading
- MySQL 8.0 Reference Manual: The Slow Query Log
- MySQL 8.0 Reference Manual: EXPLAIN
- Relevanssi user searches and logging